|
Whenever I've stood on a beach, staring at the expanse of ocean in front of me, my mind inevitably wanders to what's across the other side. After a journey of thousands of miles across featureless water, where would you end up? I've seen a few treatments of this concept, but to date none have been fully satisfying. By far, the biggest mistake is taking 'across' to mean a fixed bearing east or west, completely ignorant of the curvature of the Earth. Most people, when looking out from the US East Coast, think they're "looking at" Europe, when in fact the direction of Europe is much farther northeast, and mostly blocked by Canada; you're actually looking at Africa. That is to say: starting due east from America, a straight line along the curved surface of the Earth will hit Africa. Nevermind that most of the US East Coast faces rather south of east anyway… Other attempts do a better job, but even then feel somewhat lacking. Islands and archipelagos are overlooked, even though they may completely blot out the paths to farther continents. I want to see every scrap of rock that I may run aground on. And having a sense of relative distance would be nice, too. And lastly, to my knowledge, every previous attempt has been created manually by hand. So I created Landfall. Computing landfallStep one is to compute the landfall from a given point in all directions. This is achieved through an algorithm that determines the distance to land at many evenly spaced bearings. With enough samples (default settings compute about 50 samples per degree) you can get a smooth coastline curve of the land across the ocean from you. The algorithm is designed such that small rocks or islets are never 'missed', even if they are narrower than the spacing of samples. In finding the distance to land along a given bearing, we factor in the curvature of the (assumed spherical) Earth, as well as oddities like crossing beyond the antipode (more than halfway around the world) before hitting land. In addition to distance, the country/state of the land hit is also noted. With efficient spatial indexing, a single landfall 'viewshed' can be computed in under 30 seconds. Source dataThe source data for both coastline and political boundaries is extracted from OpenStreetMap. The coastline extract can basically be used as-is (with a few corrections that get automatically applied). The political data was much messier (failing to include outlying islands, not exactly lining up with adjacent countries, etc.), so has been curated into a cleaned dataset that lives with the project. One interesting side-effect of this project was exposing many phantom islands in OpenStreetMap that didn't actually exist. Much of OSM's coastline data comes from automated extraction of satellite imagery, which obviously will make some mistakes. On the normal map such scraps of land are nearly imperceptible, but in a landfall perspective they jump out like night and day. (I have since made edits to remove these false islands.) Visualization
Now that we've computed the raw data, how best to visualize it?
The standard answer is: superimposed on a map.
Such a view is indeed eye-opening (and exports to web map To truly capture that 'looking out upon the ocean' feeling, I wanted a first-person view. So I created a panorama-style rendering that imagines you could look beyond the horizon. Direction of view changes linearly as you scan left and right. Nearby land appears as tall massifs and farther land recedes into the distance. Sudden changes in distance to land are marked by 'creases' to add texture. Try to perceive it as a 3D perspective scene. Color-coding is also a key element of making sense of what you're looking at. Admin areas are colored automatically. Labeling, however, is manual work at this time. |
|
Featured Panoramas
|
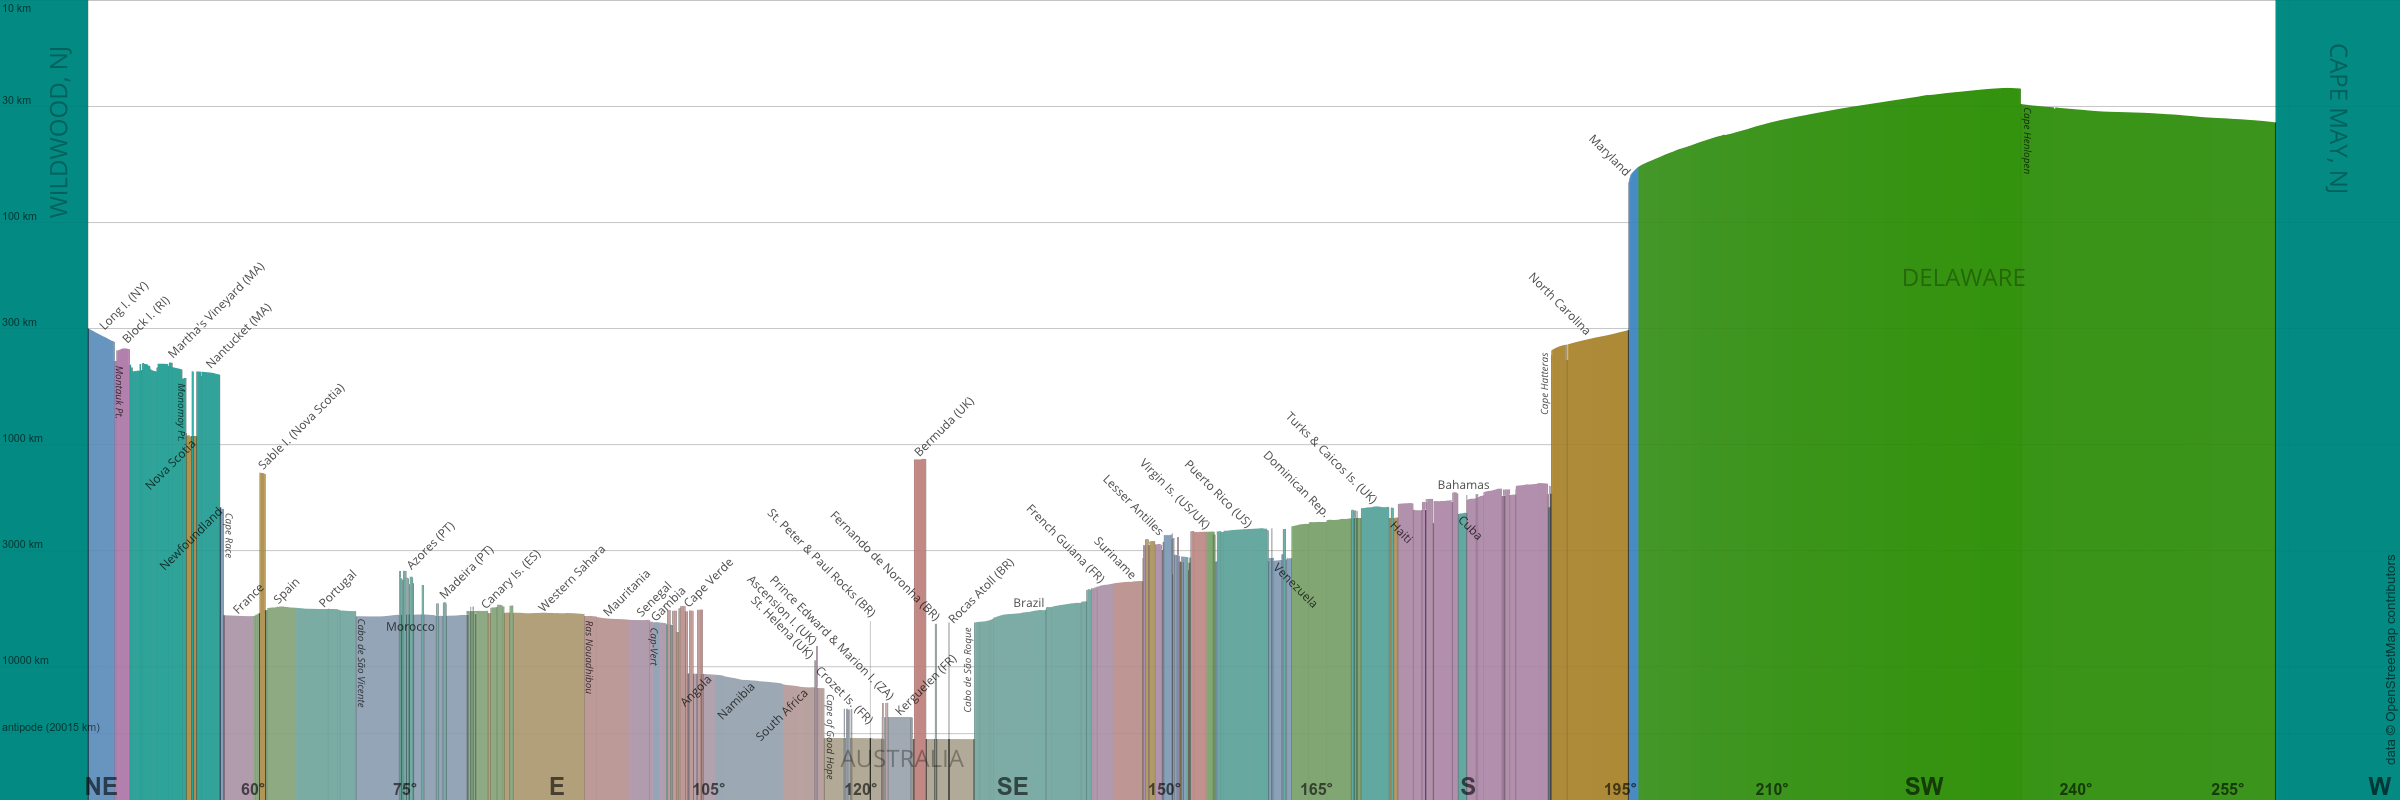
Cape May Inlet, New Jersey
|

|
|
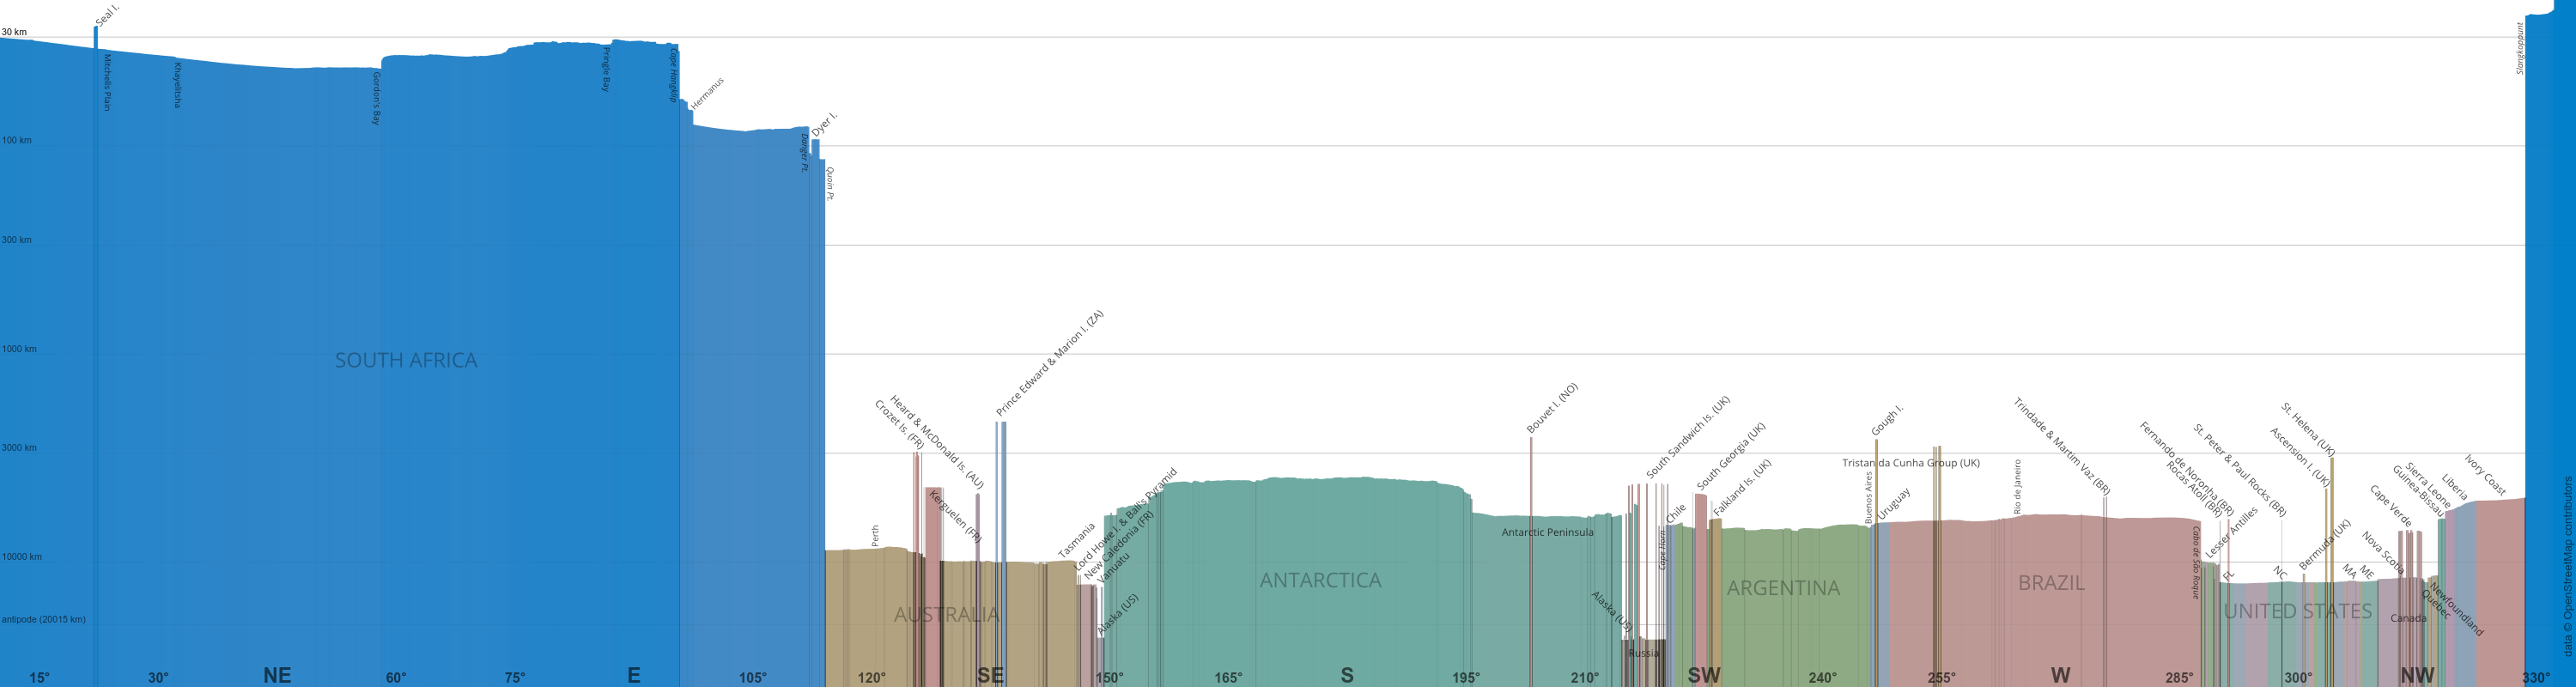
Cape of Good Hope, South Africa
|

|
|
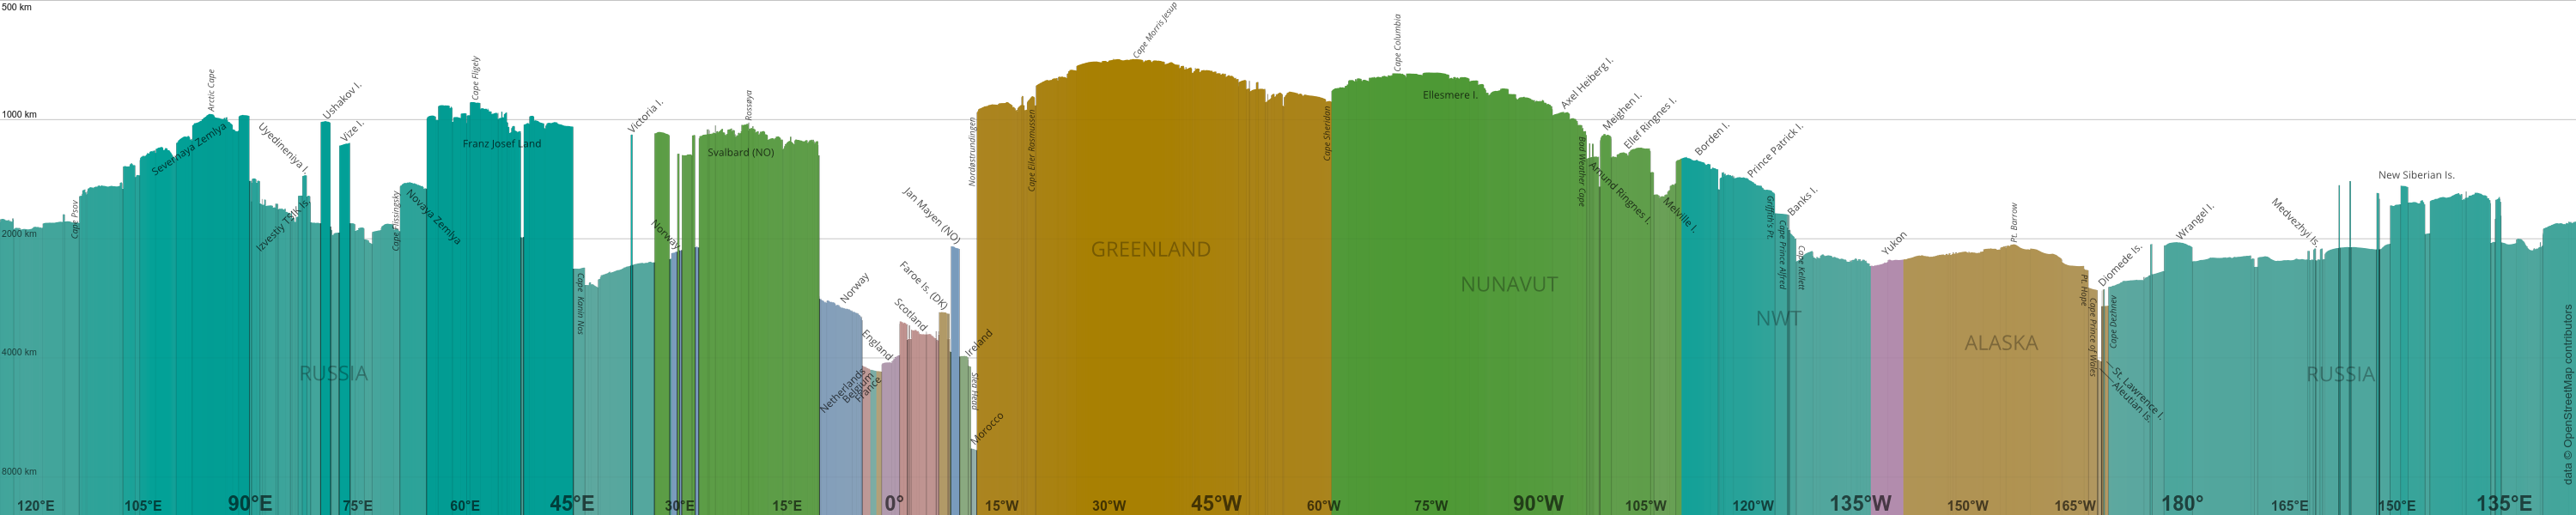
North Pole
People complain that this image is "backwards", but remember it's from the perspective of if you were actually standing at the North Pole (i.e., turning to your right moves your gaze westward).
|

|
|
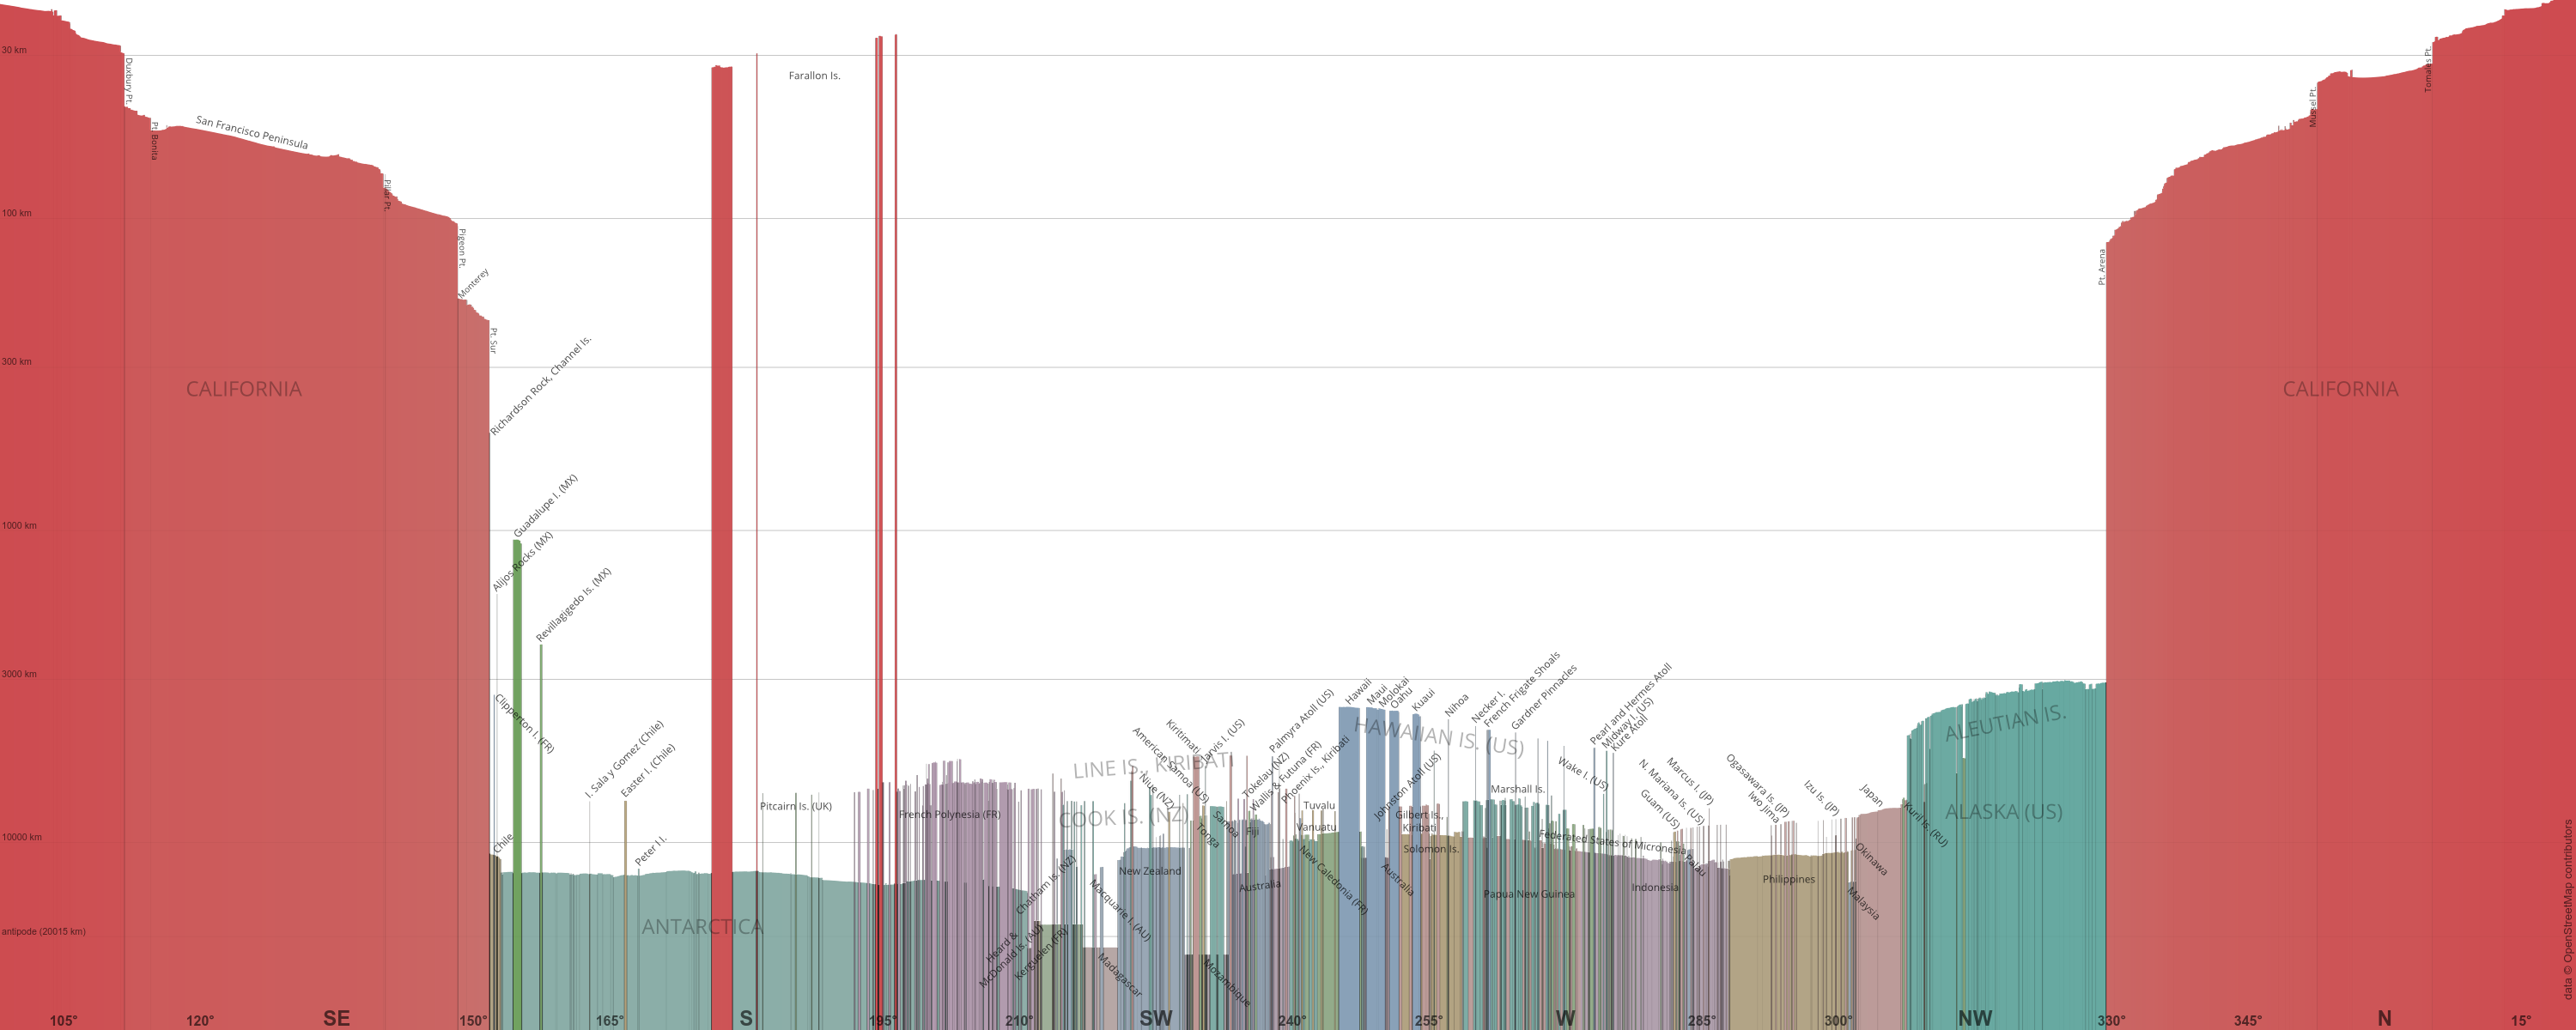
Point Reyes, California
A great vantage point for looking across the Pacific and the morass of islands therein. This one took forever to label.
|

|
|
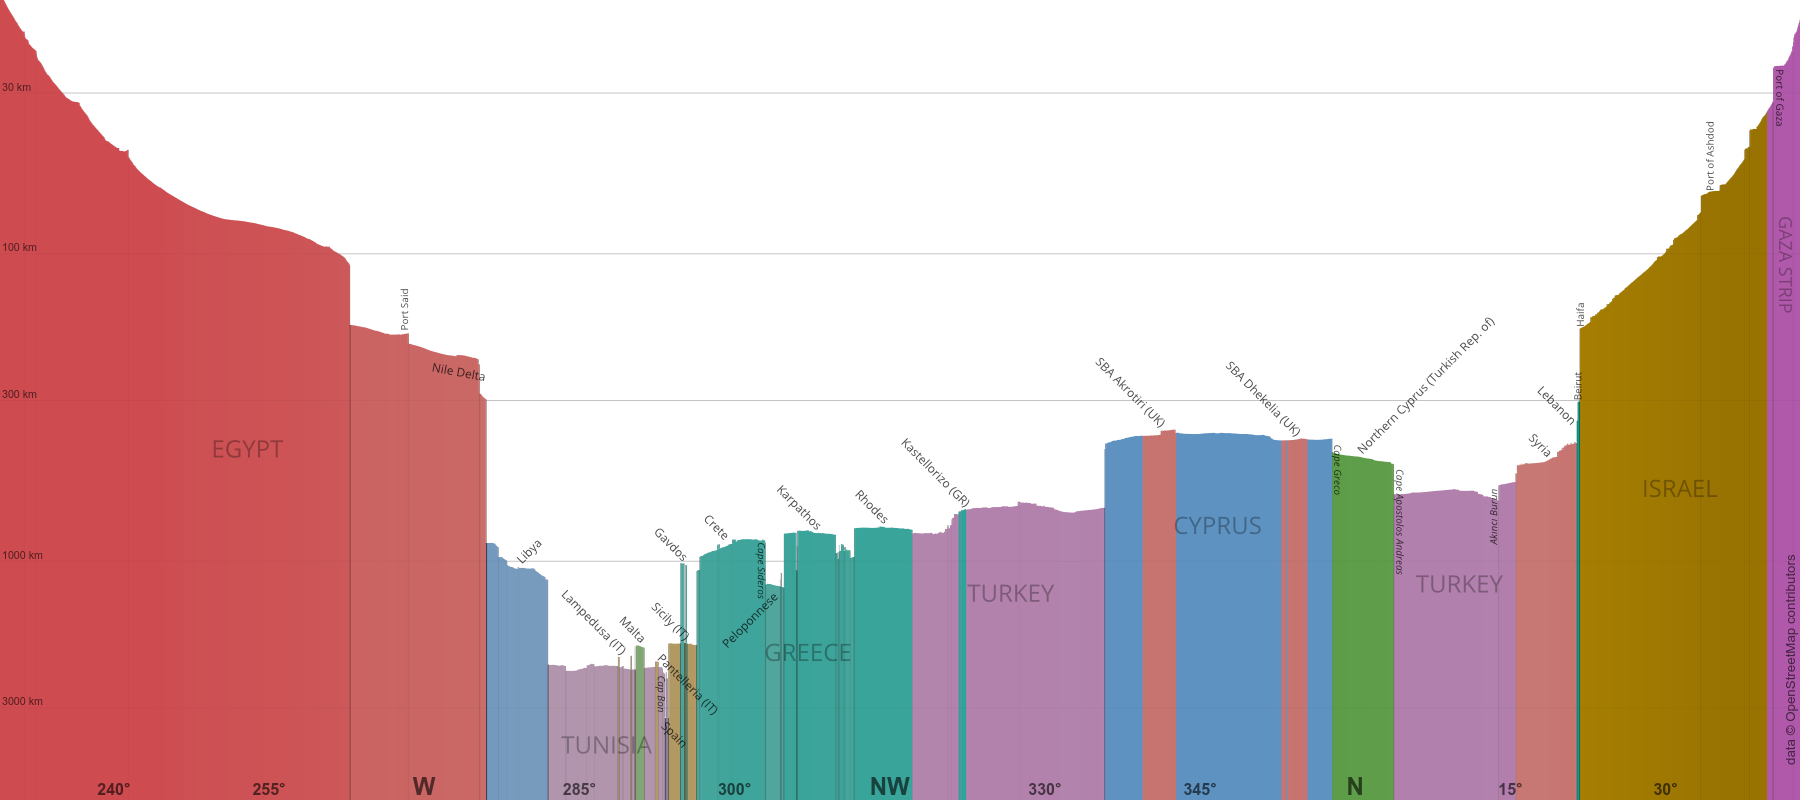
Gaza Strip
This position was actually chosen because it allows for the longest line of sight across the Mediterranean. But the context of the Israeli blockade provides some added food for thought.
|

|
|
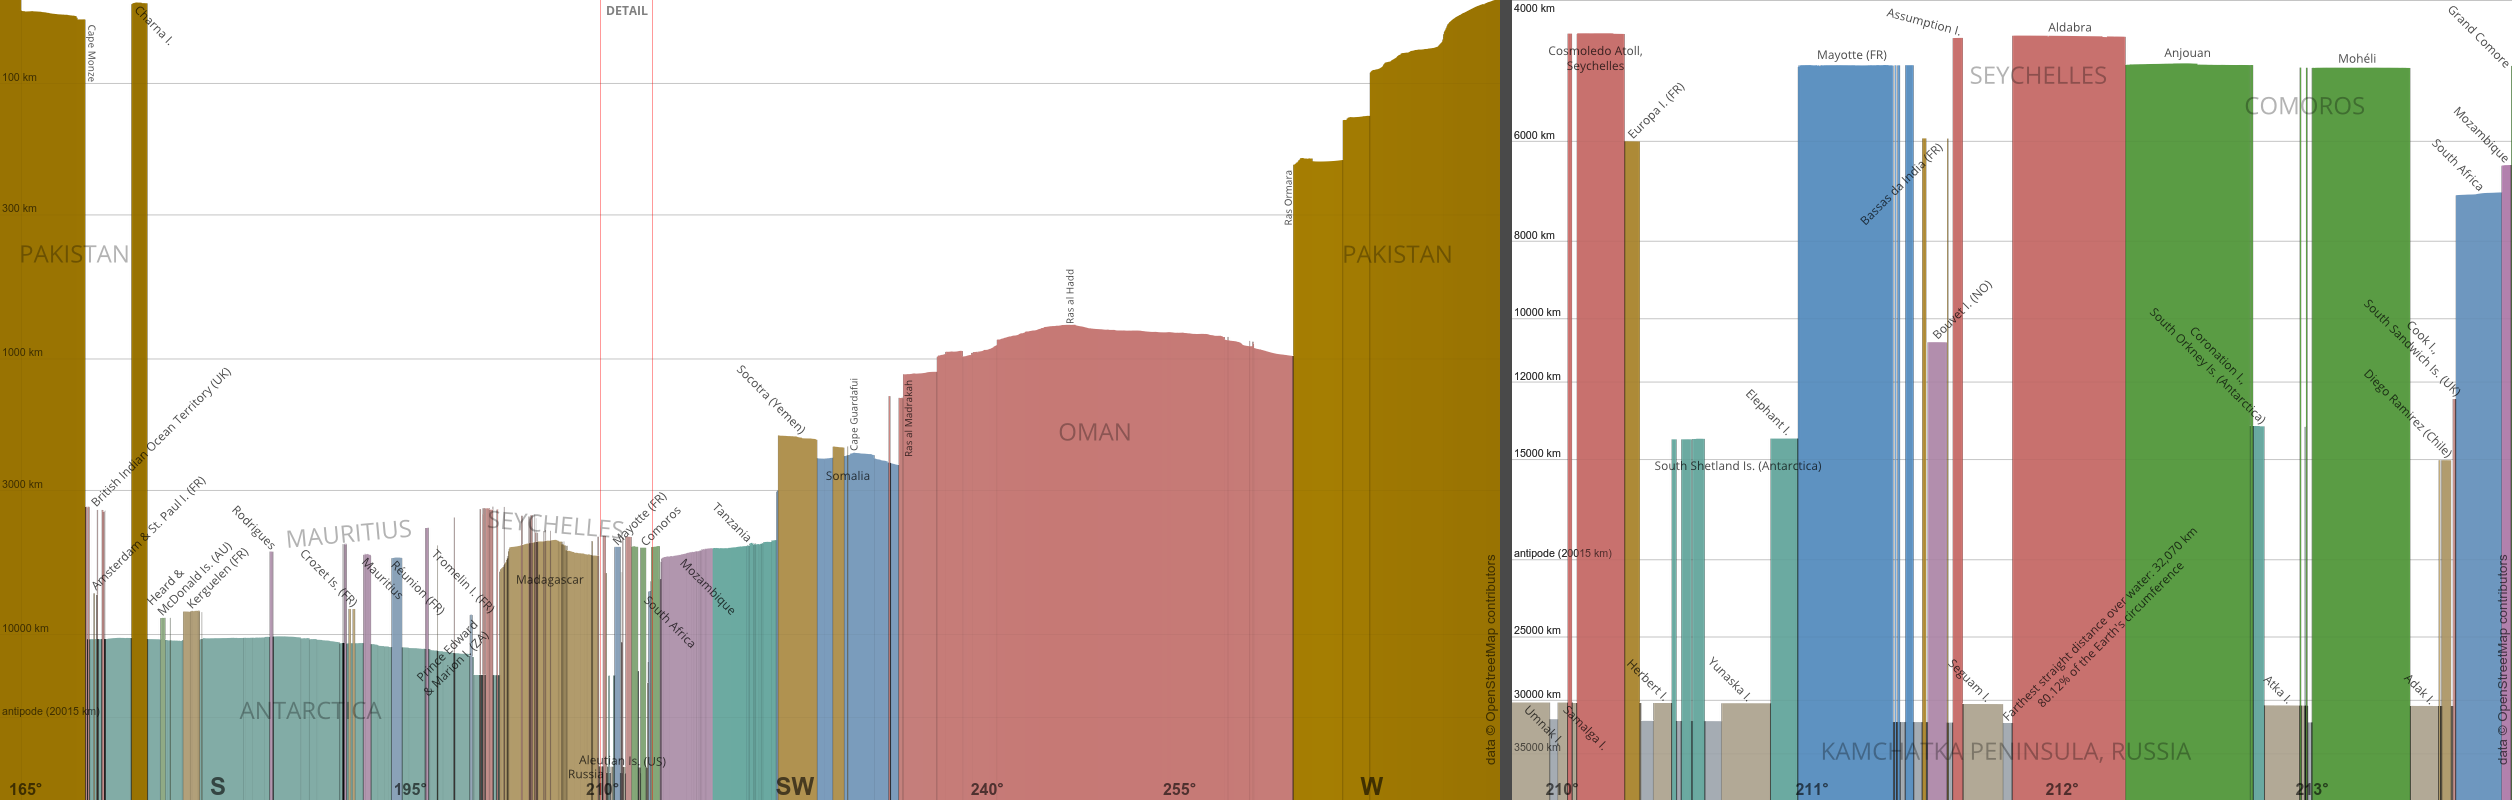
Longest Straight-line Sail:
Sonmiani Bay, Pakistan ↔ Karaginsky Gulf, Russia
This panorama displays the longest straight line over water — a journey over 80% of the way around the world without ever hitting land. This exercise is a bit disingenuous as we presume a spherical Earth, and the tolerances involved — threading the needle between the Seychelles and the Aleutian Islands — could easily be exceeded when accounting for the Earth's true shape.
|

|